
Bringing together different information from different information silos is becoming increasingly important. We will illustrate this challenge by putting ourselves in the situation of a fictitious mechanical engineering company, specializing in the development, production, sales, and servicing of hydraulic pumps.
Our company knows quite a lot about a particular hydraulic pump. It knows, for example, which product line a pump belongs to. It also knows in which plant the pump is installed, and where the plant is located. The company even knows when the pump reaches a critical maintenance cycle, what procedures then need to be performed, and which supplies are required during maintenance.
In this article, we will use this scenario to introduce the linking and virtualization of typically heterogeneous information. For this purpose, we will make use of the knowledgegraph approach. We will discuss the concepts and methods of semantic modeling and outline a possible IT architecture. At the end of the article, we will give an outlook and sketch additional scenarios that could be conceivable for our approach.
As a start: Information in rows and columns
Let’s begin with how information about a product is typically represented. Table 1 shows information presented in tabular format. (Where this information comes from and how it found its way into the table will not be discussed here; we will come back to this later.) Let’s just assume someone transferred it to an Excel file.
Row # | Product name | Product line | Plant | Location | Next maintenance interval (MI) | Required topic | Required supplies |
1 | WT-P-001 | Turbo Pelot | PANL-01 | Munich | 07/2023 | Replacing the pump head | Pump head 12 Seal XY |
2 | WT-P-002 | Turbo Pelot | PANL-02 | Wudongde | 09/2023 | Replacing the flask | Flask 12 Seal kit ZZ |
3 | WT-DS-001 | Stream One | PANL-03 | Saltstraumen | 07/2023 | Replacing the pump head | Pump head 23 Seal XY |
Table 1: Tabular presentation of product knowledge
For (most) people, the interpretation of Table 1 is relatively simple: The table header indicates which properties (such as "product line" or "plant") a product has. Each row represents a specific hydraulic pump. Finally, the table cells contain the concrete values of those properties for each pump, column by column (e.g., in row #1 the value "Turbo Pelot" for the property "Product line"). For a computer, the processing of such a table is also possible, but what if, for example, the columns are interchanged, the sequential numbers are not uniform, or the labels of the properties and/or property values are different? What if the information is distributed among various tables? How can the corresponding dependencies then be both displayed and processed by a machine?
The graph as a solution approach
It can be noted that the information given in Table 1 is characterized by three different aspects: the row, the column, and the actual value in the cell. These three aspects must be aligned with each other. This is done via identifiers of the corresponding entities; one for the row, one for the header of the respective column, and one for the value in the cell. Transferred to the statement "Hydraulic pump WT-P-001 belongs to product line Turbo Pelot", this means that we have three entities, the subject "Hydraulic pump WT-P-001", the predicate "belongs to product line" and the object "Turbo Pelot". Consequently, our statement can be represented as a triple of the three entities subject-predicate-object. If we consider the first four columns of row 1 from Table 1, we can represent the information given there as a set of triples (see Table 2).
Subject | Predicate | Object |
Hydraulic Pump | has Product Name | WT-P-001 |
WT-P-001 | belongs To Product Line | Turbo Pelot |
WT-P-001 | is Installed In | PANL-01 |
Table 2: Statements in the form of triples
For reasons of readability, we have represented the subject "Hydraulic Pump WT-P-001" in a somewhat simplified way. We will discuss this further below. For better illustration, it is useful to represent the information presented in Table 2 in the form of a directed graph (see Figure 1). The nodes of the graph represent the subject and the objects, and the edges correspond to the predicates.

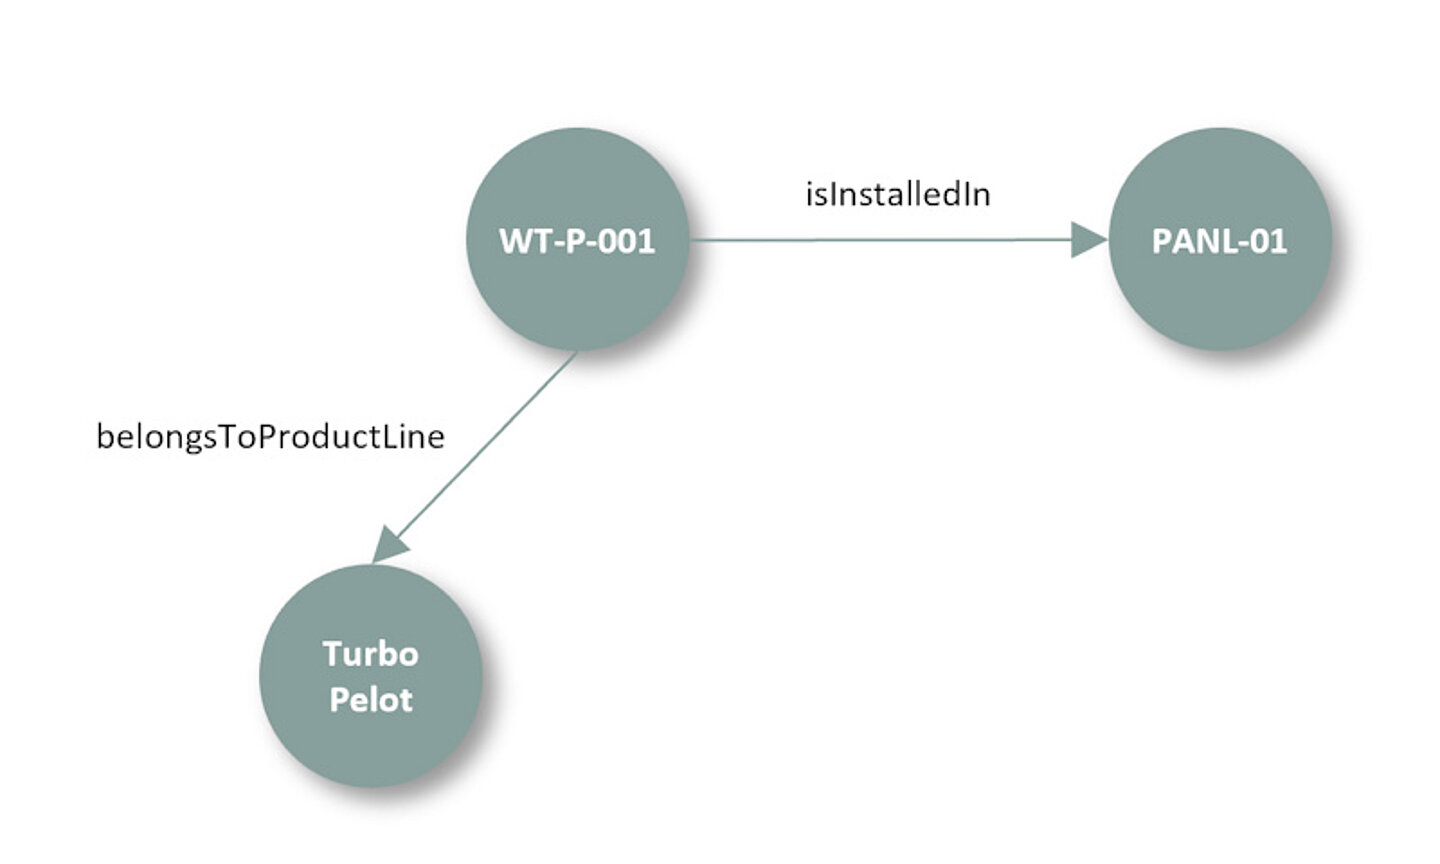
Figure 1: Graph-based representation of triples
It becomes particularly interesting when we look at the other columns from Table 1. For example, we know that the plant in which our WT-P-001 hydraulic pump is installed is located in Munich and will reach the next maintenance cycle in July 2023. The task to be performed is the replacement of the pump head. And even the supplies are known. Our statements can therefore be extended as shown in Table 3.
Subject | Predicate | Object |
PANL-01 | is Located In | Munich |
WT-P-001 | has Next MI | MI 07/2023 |
MI 07/2023 | requires Topic | Replacing pump head |
Replacing pump head | requires Supply | Pump head 12 |
Table 3: Product knowledge supplemented by statements from a service perspective
The statements from Table 3 can also be represented as a graph, and this in turn can be combined with our first graph from Figure 1, resulting in Figure 2. Due to the so-called network effect, we can now integrate further information from different parts of the company such as production (e.g., product variants), marketing (e.g., special accessories), or service (e.g., condition monitoring), giving us, as we will see below, a powerful tool for drawing inferences.

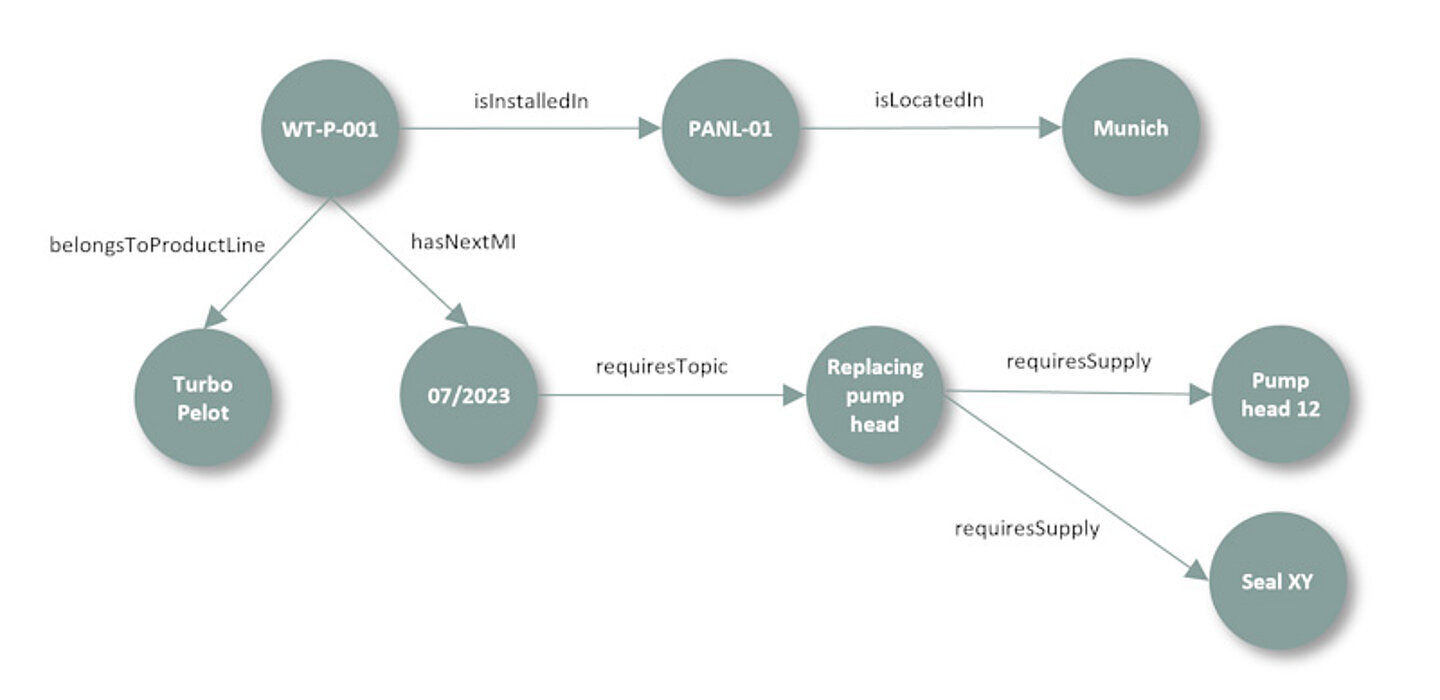
Figure 2: The network effect: A combined graph
Making graphs machine-readable
What has been described informally in the course of this article so far must be formalized in order to actually be machine-readable and computable. So-called ontologies give us the necessary framework for this. By an ontology, we mean the formal representation of a specific domain. It defines which types of entities can exist in our domain and how these entities are related to each other.
Let us illustrate this with our pump example and the statement "The hydraulic pump WT-P-001 is installed in plant PANL-01". In the ontology, the classes and relations between possible representatives of the classes are defined first. That the predicate "isInstalledIn" exists between a hydraulic pump and a plant is defined by domain restrictions (see Table 4). As we can see, even the ontology is described in the form of subject-predicate-object.
Subject | Predicate | Object |
HydraulicPump | isType | Class |
Plant | isType | Class |
isInstalledIn | isType | Predicate |
HydraulicPump | isInstalledIn | Plant |
isInstalledIn | hasDomain | HydraulicPump |
isInstalledIn | hasRange | Plant |
Table 4: Excerpt from the "pump" ontology
Concrete objects such as the hydraulic pump "WT-P-001" or the plant "PANL-01" can be described as instances of these classes. The "isInstalledIn" relation exists between both entities. This could be modeled as an inverse relation, so that "PANL-01 contains the hydraulic pump WT-P-001" is also valid (see Table 5). As a further interesting modeling option, so-called subclasses can be defined, e.g., "hydraulic pump" is a subclass of "pump".
Subject | Predicate | Object |
WT-P-001 | isType | HydraulicPump |
PANL-01 | isType | Plant |
WT-P-001 | isInstalledIn | PANL-01 |
PANL-01 | containsProduct | WT-P-001 |
Table 5: Concrete objects as instances of classes
Equipped with these considerations, we complete the graphical representation of our pump example from Figure 2 with the class information. The concrete instances are represented by circles, the associated classes by rectangles (see Figure 3).
The ontology is superimposed like a net over our information. On the one hand, the originally implicit available information from our first tables is now explicit via direct statements. On the other hand, we can also make indirect statements based on the ontology, such as "Munich belongs to the DACH sales region". Semantic modeling thus offers a wide range of possibilities for finding out dependencies between different entities.
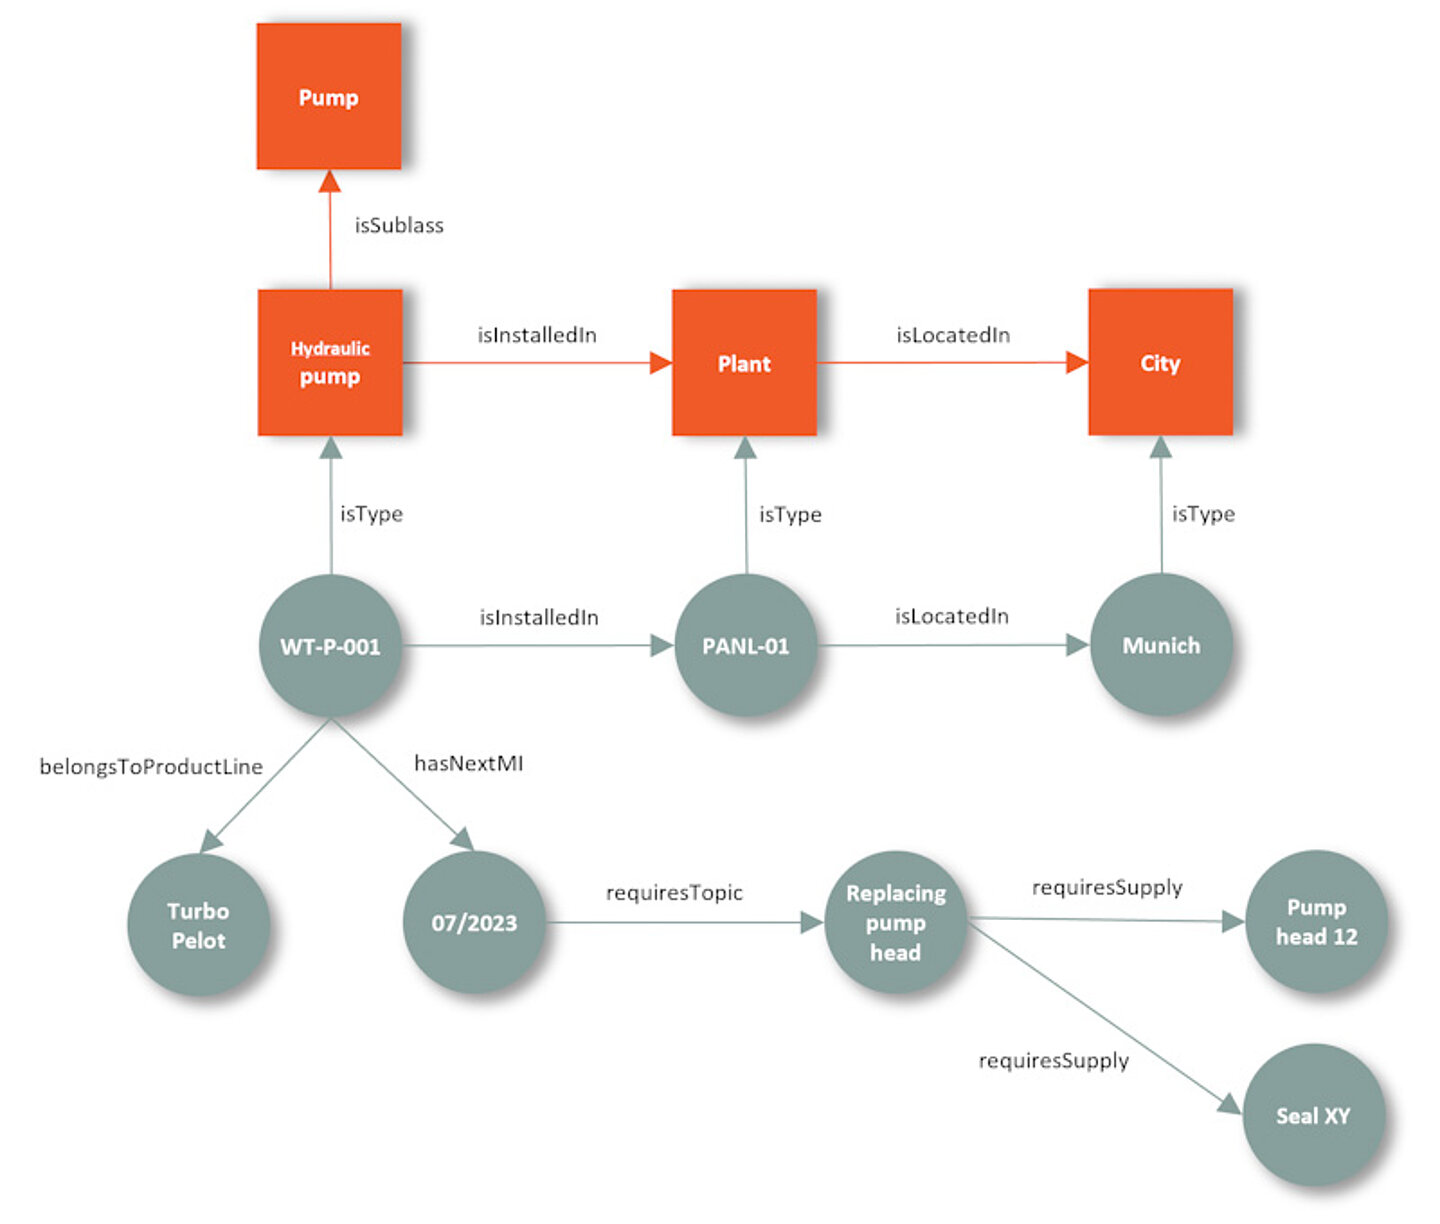
Figure 3: Statements about objects (incomplete)
Linked information
The discussion so far has not taken into account that our "pump knowledge" is stored (mostly historically!) in many different places in the company: product-related information possibly in a PLM system, technical documentation in a CCMS, and information about supplies in an SPC. Other information is often "buried" in Excel lists or resides on different drives. The challenge for our company, therefore, is to intelligently link the information needed for specific requirements and make it available centrally.
In Figure 4, we sketch a rudimentary IT architecture. There, we stick to our considerations about semantic modeling (ontology) and graph-based representation. To manage our information, we need a graph database that can process RDF data. Because our information is usually already available in "some" place in the company in various information silos, we need a conversion tool that transfers existing information to the graph database for defined use cases. We often resort to mapping, as the information we are dealing with is usually already structured or semi-structured (for unstructured information, classification and conversion can be done automatically, if necessary). For this conversion, it is important to emphasize that the goal is not to duplicate all information. The graph database may also contain what are called "proxy objects" for the actual resources in the original systems. An Inference & Query Engine gives access to the graph database to query the triples stored in RDF. Users access the content via one or more applications/interfaces.
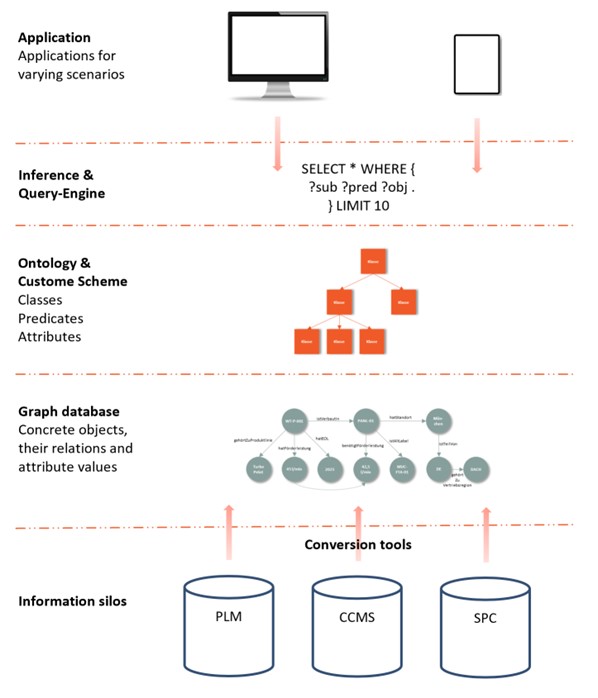
Figure 4: Sketch of an IT architecture for knowledge graph-based applications
Conclusion and outlook
In this article, we have introduced semantic modeling using an example from mechanical engineering. Its basic concepts, such as triple and graph-like representation, make it possible to intelligently link and virtualize both structured and unstructured information and different information silos. It is not always necessary to reinvent the wheel. iiRDS, for example, already provides an existing ontology developed for technical information that can be seen as part of a knowledge graph. In addition, there are established taxonomies, thesauri, or ontologies that can be used as a starting point for semantic modeling. Internal company nomenclatures or metadata taxonomies also provide a good starting point. With the help of suitable software, company-specific ontologies or custom schemes can be developed.
Knowledge graphs incorporate very different types of information from different areas of the company and offer a 360-degree view of the company. Our example is based on how product knowledge can be linked to service knowledge. A conceivable application based on such a knowledge graph would be, for example, a “tech assistant app” or a “spare parts recommender”.
Overall, we find that knowledge graphs can help to continuously improve service. They provide answers to some of the central service strategy challenges in companies, such as increasing the first time fix rate or overall equipment effectiveness or decreasing mean maintenance downtime. In addition, knowledge graphs provide an excellent basis for concrete application scenarios such as diagnostic assistants or predictive maintenance. They can help receive feedback from service technicians and close the development-production-service cycle.
Further reading
- Gutknecht, M. and M. Ley (2020): "Information bedarfsgerecht verpackt". In: technische kommunikation 3/20, pp. 28-32.
- Gartner (2021): www.gartner.com/smarterwithgartner
- Ley, M and M. Gutknecht (2021): "Mehrwert im Service. iiRDS als Basis für unternehmensweites semantisches Informationsmanagement". Presentation at tekom Frühjahrstagung.